
Frustrated by contradictory health claims and vague promises about intermittent fasting? Measuring actual cellular repair and glucose handling requires systematic clinical protocols, precise lab biomarkers, and rigid timing structures. Follow this step-by-step master evaluation framework to measure autophagy surrogates and insulin sensitivity changes across a 12-week clinical or self-directed evaluation with complete precision.
- Phase 1: Select and Define the Fasting Protocol Architecture
- Phase 2: Establish Baseline Insulin Sensitivity and Glycemic Control
- Phase 3: Implement Continuous Glucose Monitoring (CGM) Protocols
- Phase 4: Track Ketones and Calculate the Glucose-Ketone Index (GKI)
- Phase 5: Measure Direct Biomarkers of Cellular Autophagy
- Phase 6: Align Physical Training and Exercise Micro-Dosing
- Phase 7: Monitor Autonomic System Tone and Stress Load
- Phase 8: Audit Body Composition and Lean Tissue Retention
- Phase 9: Compile, Analyze, and Adjust the Protocol
- Frequently Asked Questions
- How long must a person fast before true autophagy begins in human clinical trials?
- Can black coffee or artificial sweeteners break a fast intended for evaluating autophagy?
- What is the difference between physiological and pathological insulin resistance during fasting?
- How frequently should blood autophagy markers be tested in a clinical trial?
- Estimated Time: 12-week study evaluation (15 minutes daily data logging).
- Difficulty Level: Advanced / Clinical Specialist.
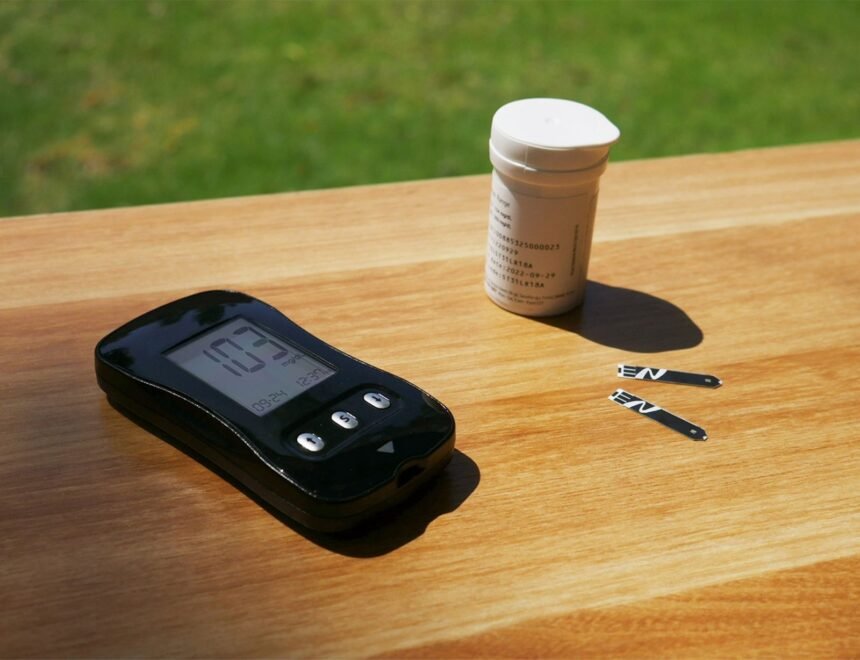
- Required Tools / Items: Dual Glucose and Ketone Meter (Keto-Mojo BK), Continuous Glucose Monitor (Dexcom G7 or FreeStyle Libre 3), LC-MS/MS Blood Panel (HOMA-IR, Fasting Insulin, High-Sensitivity CRP).
Phase 1: Select and Define the Fasting Protocol Architecture
Establish exact feeding and fasting windows. Selecting the wrong intermittent fasting window introduces uncontrolled variables that ruin data integrity. Human clinical trials typically test three core architectures: Time-Restricted Eating (TRE 16:8 or 18:6), Alternate-Day Fasting (ADF), or Periodic Fasting-Mimicking Diets (FMD). For measuring insulin sensitivity changes, early time-restricted feeding (eTRE) with eating restricted between 8:00 AM and 4:00 PM yields high insulin sensitivity gains due to peripheral circadian alignment.
Fix the caloric and macronutrient control baseline. Fasting evaluations fail when changes in insulin action stem from unintentional caloric deficits rather than the fasting window itself. Maintain an isocaloric intake during non-fasting periods. Calculate Total Daily Energy Expenditure (TDEE) using the Mifflin-St Jeor formula and maintain a strict 30% protein, 40% carbohydrate, and 30% fat breakdown during non-fasting hours to keep nutrient variables constant throughout the trial.
Document baseline parameters for 14 full days before changing eating patterns. Record baseline meal timing, bedtime, waking time, and average daily fasting glucose levels. Eliminating early confounding variables guarantees that measured changes in metabolic parameters directly stem from the timed fasting intervention.
Phase 2: Establish Baseline Insulin Sensitivity and Glycemic Control
Order targeted fasting metabolic blood panels. Schedule an early-morning blood draw after a strict 12-hour overnight fast under professional medical supervision. Measure serum fasting insulin (micro-units per milliliter, mcU/mL), fasting plasma glucose (mg/dL), Hemoglobin A1c (HbA1c), and quantitative C-peptide levels. These measurements establish your quantitative baseline prior to protocol initiation.
Calculate the HOMA-IR and QUICKI scores. Calculate the Homeostatic Model Assessment for Insulin Resistance (HOMA-IR) using the formula: (Fasting Insulin x Fasting Glucose) / 405. A value below 1.0 represents optimal insulin sensitivity, while values above 1.9 indicate early insulin resistance. Calculate the Quantitative Insulin Sensitivity Check Index (QUICKI) as 1 / (log(Fasting Insulin) + log(Fasting Glucose)) to cross-verify peripheral tissue responses.
- Draw baseline fasting insulin and glucose: Sample at 08:00 AM after 12 hours of uninterrupted water-only fasting.
- Perform a standard 75g Oral Glucose Tolerance Test (OGTT): Administer 75 grams of anhydrous glucose dissolved in water. Draw blood samples at 30, 60, 90, and 120 minutes to plot glucose clearance velocity.
- Calculate glucose and insulin Area Under the Curve (AUC): Plot time vs. concentration graph data to calculate total glycemic excursion using the trapezoidal rule.
Phase 3: Implement Continuous Glucose Monitoring (CGM) Protocols
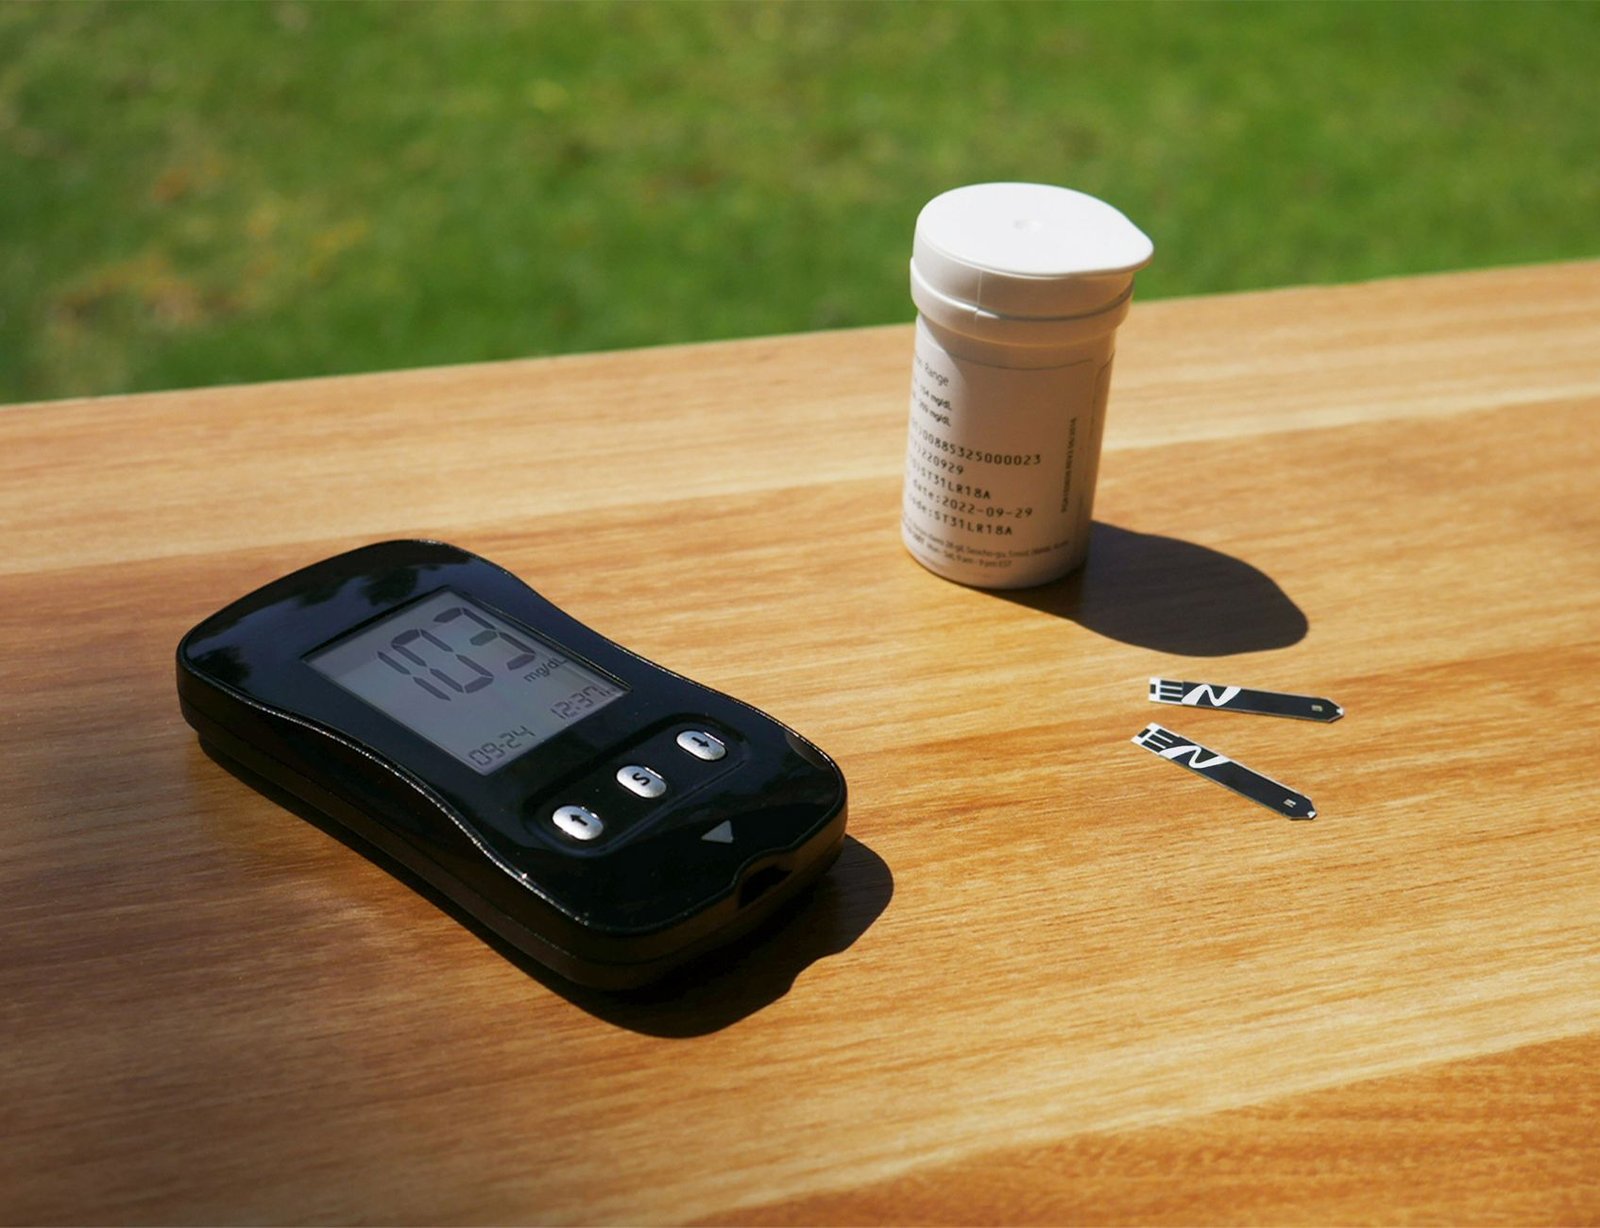
Apply a high-precision continuous glucose sensor. Apply a factory-calibrated CGM sensor to the posterior upper arm 48 hours before day one of the protocol to clear the insertion inflammatory artifact period. Set sampling intervals to 5 minutes to capture real-time glycemic variability, nocturnal hypoglycemia dips, and postprandial glucose peaks.
Track key interstitial glucose metrics daily. Monitor Mean Glucose, Standard Deviation (SD), Coefficient of Variation (CV), and Time in Range (TIR, 70–140 mg/dL). Aim for a glycemic Coefficient of Variation below 20% during fasting hours, which directly reflects stabilized liver glycogen breakdown and reduced hepatic gluconeogenesis.
Correlate glucose curves with acute lifestyle stressors. Exercise, poor sleep, and acute psychological stress elevate cortisol, causing temporary glucose spikes that mimic dietary non-compliance. Reviewing aromatherapy patches vs diffusers for anxiety can help manage nervous system activation and prevent stress-induced glucose spikes from warping your fasting trial data.
Phase 4: Track Ketones and Calculate the Glucose-Ketone Index (GKI)
Measure capillary beta-hydroxybutyrate (BHB) levels. Use a dedicated capillary blood ketone meter daily at 08:00 AM and 05:00 PM. Hepatic ketogenesis begins when liver glycogen depletes, serving as a reliable surrogate marker that circulating insulin levels have dropped sufficiently to permit lipolysis and autophagy initiation pathways.
Compute the Glucose-Ketone Index (GKI). Divide blood glucose concentration (mg/dL) by 18, then divide that result by blood BHB (mmol/L). The formula is: GKI = (Glucose mg/dL / 18) / BHB mmol/L. Track GKI values across three target threshold tiers to categorize metabolic strain:
Map GKI ranges to metabolic states: A GKI between 6.0 and 9.0 indicates mild ketosis; a GKI between 3.0 and 6.0 represents moderate functional ketosis and improved insulin sensitivity; a GKI below 3.0 signifies deep therapeutic ketosis where autophagy biomarkers peak in human tissue models.
Phase 5: Measure Direct Biomarkers of Cellular Autophagy
Order specialized peripheral blood mononuclear cell (PBMC) assays. Direct autophagy assessment in humans relies on blood-derived mononuclear cells using Western blotting or enzyme-linked immunosorbent assay (ELISA) kits. Request quantification of LC3-II to LC3-I conversion ratio and p62/SQSTM1 protein degradation levels from specialized research facilities at week 0, week 6, and week 12.
Evaluate p62 clearing rates. Autophagy operates as a selective cellular waste removal system; p62 binds ubiquitin tag targets and degrades inside the autolysosome. A drop in PBMC p62 concentration alongside an elevated LC3-II/LC3-I ratio provides direct biochemical confirmation of active autophagic flux rather than simple autophagy blockade.
Track secondary systemic markers of autophagic activity. Monitor secondary systemic proxies, including serum spermidine concentrations, plasma total antioxidant capacity (TAC), and decreased phosphorylated mTOR (p-mTOR) levels in serum samples. A reduction in p-mTOR to total mTOR ratio signals active cellular nutrient-sensing inhibition.

Phase 6: Align Physical Training and Exercise Micro-Dosing
Time resistance training to optimize GLUT4 translocation. Muscle contractions pull glucose from the bloodstream via non-insulin-dependent GLUT4 transporter translocation. Schedule strength training near the end of daily fasting windows to clear glycogen stores faster and accelerate hepatic autophagy without triggering excessive muscle protein catabolism.
Incorporate strategic low-intensity physical activity. High-intensity workouts during extended fasts can elevate circulating cortisol, driving unwanted gluconeogenesis and raising fasting blood sugar. Reading Micro-Workouts vs Long Gym Sessions for Busy Professionals: Which Actually Wins for Fat Loss? provides clear protocols for structuring short exercise sessions that protect lean muscle during fasting periods.
- Perform 15-minute zone-2 cardio sessions: Execute low-intensity cardio at 60-70% of maximum heart rate near the end of your fast to accelerate lipid oxidation.
- Conduct micro-resistance blocks: Complete bodyweight squats or push-ups 30 minutes before meal breaks to prep skeletal muscle insulin receptors.
- Log post-workout capillary glucose drop: Verify that blood glucose drops 10-20 mg/dL within 45 minutes after exercise to confirm effective GLUT4 recruitment.
Phase 7: Monitor Autonomic System Tone and Stress Load
Track Heart Rate Variability (HRV) during extended fasts. Fasting acts as an acute hormetic stressor on the central nervous system. Use a wearable device to monitor nocturnal root mean square of successive differences (RMSSD). A sustained drop in RMSSD exceeding 20% below your 30-day baseline indicates excessive sympathetic dominance, elevated systemic cortisol, and impaired glucose tolerance.
Incorporate parasympathetic resetting techniques. Unregulated nervous system stress increases adrenal output, keeping hepatic glucose release high even during 18-hour fasts. Evaluating somatic exercises for stress relief vs traditional yoga for mindful wellness offers practical ways to down-regulate sympathetic tone, lower baseline cortisol, and maintain accurate insulin testing parameters.
Maintain consistent sleep duration and architecture. Partial sleep deprivation (under 6 hours per night) for just three consecutive nights reduces insulin sensitivity significantly in healthy adults. Mandate a strict 8-hour sleep window in a dark room kept between 65 and 68 degrees Fahrenheit throughout the entire 12-week trial.
Phase 8: Audit Body Composition and Lean Tissue Retention
Schedule dual-energy X-ray absorptiometry (DEXA) scans. Weight scale changes alone cannot distinguish lean mass loss from body fat reduction or water shifts. Perform a baseline DEXA scan at week 0 and repeat scans at week 6 and week 12 under identical hydration states to track true tissue adjustments.
Calculate Appendicular Skeletal Muscle Index (ASMI). Calculate ASMI by dividing the sum of arm and leg lean mass (kg) by height in meters squared (kg/m²). Ensure that ASMI stays within 2% of baseline throughout the protocol to prove that fasting-induced weight loss originates from visceral adiposity rather than skeletal muscle degradation.
Monitor visceral adipose tissue (VAT) area reduction. Visceral fat releases pro-inflammatory cytokines like TNF-alpha and IL-6 that directly block insulin signaling cascades. Track VAT mass reduction in grams via DEXA; shrinking visceral fat stores directly correlates with improved HOMA-IR and restored cellular insulin sensitivity.
Phase 9: Compile, Analyze, and Adjust the Protocol
Synthesize week 12 end-of-trial clinical markers. Repeat all baseline diagnostic tests at week 12, including the 12-hour fasting insulin, glucose, HOMA-IR, C-peptide, lipid subfractions, and PBMC autophagy panels under professional clinical supervision. Compare pre-trial and post-trial data side-by-side using standardized percent change calculations.
Evaluate success criteria against target benchmarks. Determine protocol efficacy based on established research target metrics:
- HOMA-IR Reduction: Greater than 25% decrease from baseline.
- Fasting Serum Insulin: Lowering target range to 2.0–6.0 mcU/mL.
- Glycemic Variability (CGM CV): Maintained consistently below 18%.
- Autophagic Flux (PBMC p62 degradation): Greater than 15% drop relative to baseline, indicating active lysosomal degradation.
Refine fasting windows based on long-term compliance. If HOMA-IR improves but cortisol elevates and HRV drops, widen the eating window by 2 hours (e.g., transition from 18:6 to 16:8). Tailor the final daily protocol to sustain long-term compliance while preserving the metabolic gains achieved during the 12-week evaluation period.
If morning fasting blood glucose spikes higher during weeks 2–4 of fasting (the dawn phenomenon), do not panic. This is driven by early-morning cortisol signaling hepatic gluconeogenesis while peripheral tissues are keto-adapted. Address this by drinking 500 mL of water with 300 mg of sodium and 100 mg of potassium upon waking, and move your physical exercise to the morning to clear circulating glucose via non-insulin-dependent GLUT4 pathways.
Never rely on blood glucose levels alone to evaluate fasting efficacy. Elevated blood glucose paired with high blood ketones (BHB > 1.5 mmol/L) simply indicates active lipolysis and physiological insulin resistance—a benign, reversible adaptation where muscle tissue conserves glucose for red blood cells. Always cross-reference glucose numbers with circulating insulin levels to get an accurate picture of true metabolic health.
Frequently Asked Questions
How long must a person fast before true autophagy begins in human clinical trials?
In humans, basal autophagy occurs continuously at low levels. Significant upregulation of autophagic flux in human peripheral blood mononuclear cells typically requires 18 to 24 hours of total fasting, co-occurring with liver glycogen depletion and blood BHB concentrations exceeding 1.0–1.5 mmol/L.
Can black coffee or artificial sweeteners break a fast intended for evaluating autophagy?
Black coffee does not break autophagy; in fact, polyphenols in coffee like chlorogenic acid stimulate autophagy pathways in animal and cell models. However, artificial sweeteners can trigger cephalic-phase insulin release in sensitive individuals; elevated insulin blocks lipolysis and suppresses autophagic flux.
What is the difference between physiological and pathological insulin resistance during fasting?
Pathological insulin resistance is characterized by high fasting glucose combined with high fasting insulin and elevated systemic inflammatory markers. Physiological insulin resistance (adaptive glucose sparing) occurs during prolonged fasting or ketogenic diets where fasting insulin remains very low while muscles restrict glucose uptake to reserve glucose for the brain.
How frequently should blood autophagy markers be tested in a clinical trial?
Because direct PBMC autophagy assays (LC3-II/LC3-I ratio and p62 levels) require specialized laboratory processing and show gradual systemic shifts, testing at 0, 6, and 12 weeks provides clear baseline, mid-point, and post-intervention data without overburdening participants or study budgets.